
Walmart posted $713.2 billion in revenue for fiscal year 2026, growing 4.7%. On the same earnings call where that number was delivered, new CEO John Furner described two groups of shoppers: households earning over $100,000, whose purchases drove the majority of the company’s market share gains, and households earning under $50,000, whose “wallets are stretched” and who, “in some cases, are managing spending paycheck to paycheck.”
Walmart is uniquely positioned to say something like that and mean it. Unlike a luxury retailer, which only sees what affluent shoppers are buying, or a dollar-store chain, which skews toward struggling households, Walmart sells to nearly everyone. Its checkout data is something close to a population sample. When its executives describe a split at the register, they are describing a split in the country.
The gap between those two groups has been widening for years, and the numbers arriving in 2026 have made it harder to set aside. The Walmart income inequality story reflects where American consumer spending now lives, which households are holding it up, and which are quietly falling behind.
What the Walmart Data Actually Shows
Walmart’s Q4 fiscal 2026 earnings built on an existing trend in consumer behavior by income. “Again this quarter, the majority of our share gains came from households making more than $100,000,” CEO John Furner told analysts. On the other side of the ledger: “For households earning below $50,000, we continue to see that wallets are stretched,” with some managing spending “paycheck to paycheck.”
In the prior fiscal year, former CEO Doug McMillon had reported that shoppers from households earning more than $100,000 made up 75% of Walmart’s market share gains in the third quarter. The pattern has held quarter after quarter. Research from GlobalData Retail shows that nearly 28% of high-income consumers shopped at discount retailers such as Walmart in 2025, up from around 20% in 2021, and more than 17% of Americans earning at least $100,000 now shop at Walmart, compared with less than 15% in 2021. The affluent shopper didn’t discover Walmart by accident. CFO John David Rainey acknowledged the shift directly, and Walmart has made major changes to attract higher-income shoppers, renovating more than 1,400 stores and adding more upscale products. “I think it’s indicative of how Walmart is changing and how our customer base is changing,” Rainey said.
The K-Shaped Economy Behind the Walmart Income Inequality Numbers
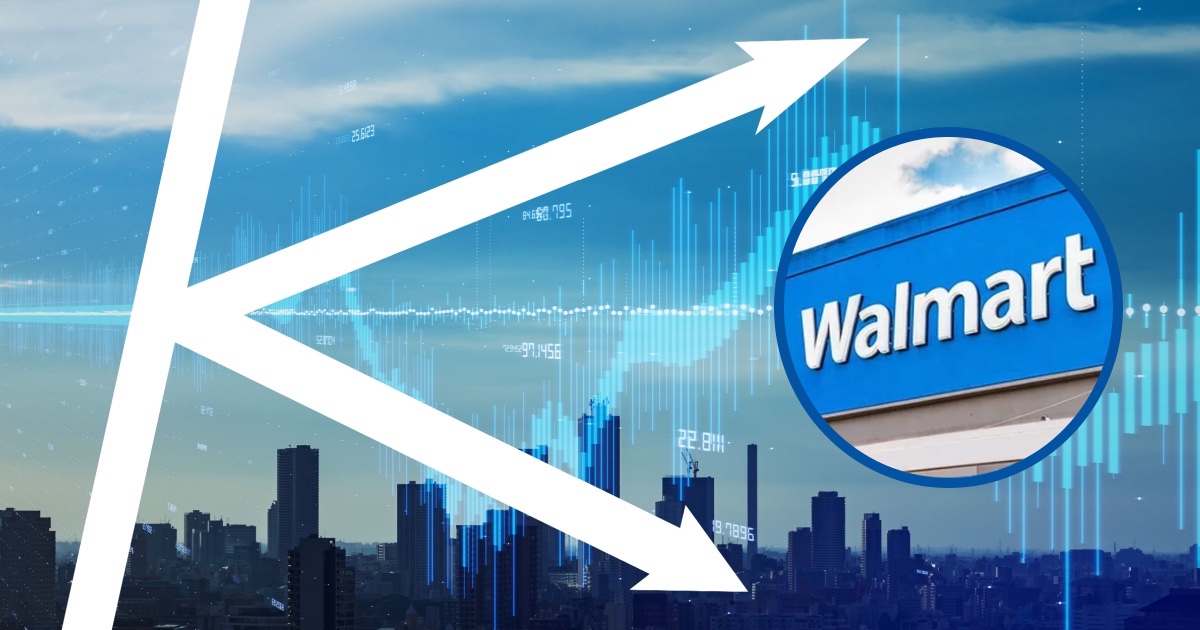
A K-shaped economy describes a recovery or growth cycle where high-income households move upward while lower-income households stagnate or fall – the letter’s two arms pointing in opposite directions at once. The top 1% of U.S. households held 31.7% of all household wealth in the third quarter of 2025, the highest share recorded since the Federal Reserve began tracking household wealth in 1989. In dollar terms, that group holds an estimated $55 trillion in assets, roughly equal to the combined wealth of the entire bottom 90% of Americans.
Consumer spending reflects that concentration directly. Mark Zandi, chief economist of Moody’s Analytics, found that the top 20% of the income distribution now accounts for nearly 60% of all personal outlays. In the twelve months through Q1 2026, the top 20% increased their outlays by 6.5%, while the bottom 80% grew just 2.6%, falling short of 2.7% CPI inflation.
Wage growth is compounding the divergence. Bank of America data shows that higher-income households saw after-tax wage growth of 5.6% year-over-year in March 2026, versus just 2.0% and 1.0% for middle- and lower-income households, respectively – the widest gap in growth rates since 2015. The growing divide is also being driven in part by surging stock prices, with wealthier households benefiting most from bull markets because a larger share of their wealth is invested in stocks and other securities. According to Gallup, 87% of Americans who own stocks are adults living in households earning $100,000 or more.
When stock prices rise, that wealth effect flows almost entirely to the top of the income ladder. When grocery prices rise, the pain flows in the opposite direction.
The Gas Pump as a Wealth Divider
Few expenses separate income groups as cleanly as gasoline. According to data from 101financial, the average American household will pay approximately $857 more on gasoline in 2026 due to oil price surges, and families earning below $30,000 a year spend approximately 7.1% of their total income on gasoline alone, compared to 2 – 3% for higher-earning households.
That gap matters enormously at the Walmart register. When a lower-income family spends an extra $800 to $900 on fuel, something else has to give. Often, it’s groceries, clothing, or household goods. The items that Walmart’s lower-income shoppers used to buy more of get trimmed or cut entirely. In May 2026, Walmart executives told analysts that “higher than anticipated fuel costs” were squeezing shoppers and said consumers should expect higher prices in the second half of 2026 if costs remained elevated.
Consumers have also had to navigate price hikes on many goods as a result of President Donald Trump’s wide-ranging tariffs on major U.S. trading partners. That pressure hasn’t landed evenly. Last year, lower-income households bore a disproportionate share of tariff-related price increases, spending a larger fraction of their income on the goods most affected. Walmart CEO Doug McMillon confirmed the effect: middle- and lower-income households have been more sensitive to tariff-related price increases in discretionary categories.
What Grocery Prices Are Doing to Stretched Budgets
Inflation hasn’t gone away for the households Walmart once called its core customer. Grocery prices rose 2.9% in April 2026, the steepest hike in years, with federal data from the U.S. Bureau of Labor Statistics confirming that “food at home” prices rose 2.9% over the 12 months through April 2026. Overall inflation surged to a three-year high of 3.8% by the end of April, rising faster than wages, which grew by 3.6%. When prices climb faster than paychecks, purchasing power shrinks even if people are technically earning more.
The spending gap between income groups is stark in dollar terms. The lowest income quintile of U.S. households averages around $29,046 in annual expenditures, while the highest quintile averages $151,342, more than five times as much. An extra $50 per month in grocery bills hits a $29,000 household budget very differently than it hits a $150,000 one.
Middle-income households tend to have their wealth tied up in their homes, and house price growth has been slowing. Lower-income Americans are struggling with higher debt loads. Neither group is drawing down an equity portfolio to cover rising costs the way the top quintile can.
For households already feeling the squeeze, the grocery store has become a place of constant small reckonings – reaching for the store brand instead of the name brand, skipping the item that jumped 40 cents since last week. Food-at-home prices are still climbing, and supply-chain costs have not yet fully passed through to retail shelves, according to Moody’s Analysis of Federal Reserve personal finance data, which found the bottom 80% of earners have seen real spending growth close to flat since the pandemic.
Why Walmart’s Growth Doesn’t Contradict the Struggle
Walmart’s fiscal 2026 revenue, up 4.7% to $713.2 billion, stays aloft because the people doing the most spending are doing well – and those people are now spending at Walmart. The top 20% increased outlays by 6.5% in the year ending Q1 2026, while for the bottom 80%, real spending was essentially flat. A broad-based retailer can grow even amid widespread consumer financial strain when the spending concentration is this severe.
As Mark Zandi put it: “The K-shaped economy – with the well-to-do thriving and everyone else lagging – remains firmly intact, and there is no sign that the trend line will reverse soon.” Consumer sentiment dropped 18.5% in the last year, a majority of people believe the economy is going poorly, and yet a wealthy, prospering minority is driving headline revenue growth. When consumer spending holds up largely because the top 20% are spending more, the headline numbers can look solid while the majority of households quietly absorb rising costs with no comparable asset buffer.
Read More: Walmart, Amazon, Target, Kroger: Who’s Warning You About Higher Prices in 2026
What This Means for You
The two groups Walmart described on that earnings call aren’t abstractions. If you earn over $100,000, the current environment is broadly working for you: wages are growing faster, stocks are up, and even your new relationship with Walmart’s pickup and delivery service is saving you time and money. Your spending power is intact, and in some categories, it’s growing.
If you earn under $50,000, the math is running in the other direction. Fuel costs alone are consuming a 7.1% slice of income, groceries are at a three-year high, and tariff-related price increases have hit the discretionary categories that stretch a budget. The practical response is to treat your grocery budget as a variable worth actively managing. Track which categories have climbed the most, stock up on non-perishables when prices allow, and lean on store brands where the quality difference is minimal.
For anyone in the middle, the wage growth gap is the number to watch. Bank of America data shows higher-income households seeing wages grow at 5.6% in March 2026, while middle-income households are at just 2.0%. If your income sits below those thresholds and your fixed costs are rising with inflation, the gap between what you earn and what everything costs is quietly widening. The Walmart earnings call didn’t create that gap. It just described it, plainly, in a single sentence on a Thursday morning call with Wall Street.
Disclaimer: This information is not intended to be a substitute for professional financial advice, investment advice, tax advice, or legal advice, and is provided for informational purposes only. Always seek the guidance of a qualified financial advisor, accountant, or other licensed professional regarding your personal financial situation or investment decisions. Do not make financial, investment, or tax decisions based solely on information presented here. Past performance is not indicative of future results, and all investments carry risk, including the potential loss of principal.
AI Disclaimer: This article was created with the assistance of AI tools and reviewed by a human editor.
Read More: 10 Walmart Secrets That Regular Shoppers Don’t Know About