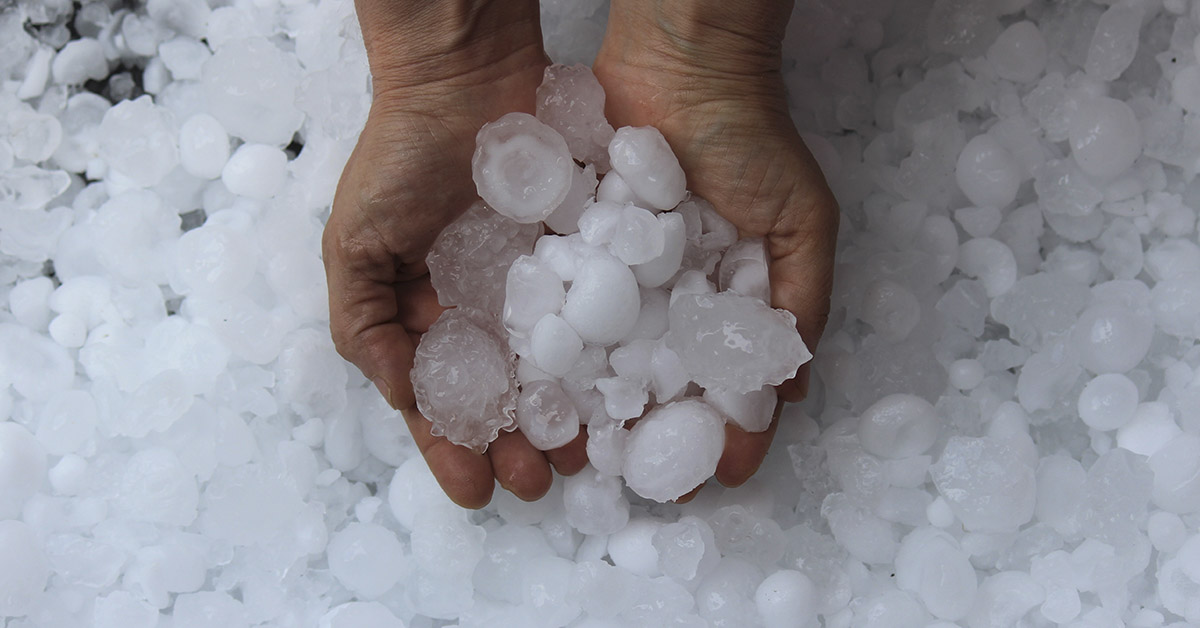

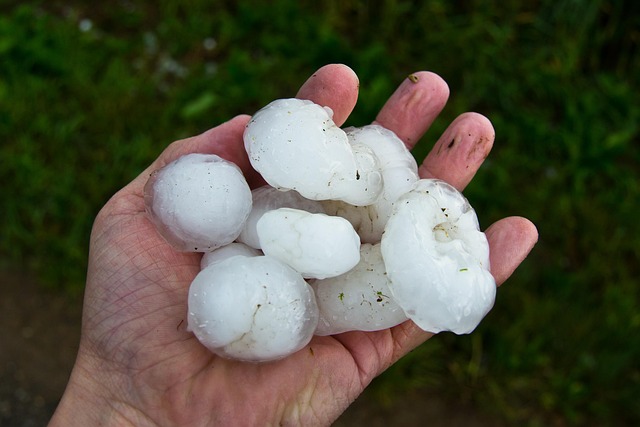
Some people love the steady pitter-patter sound of rain on the rooftops. Other people love playing in the snow or watching it fall from inside the warmth of their homes. Hail, however, is rarely met with the same level of joy or excitement. In fact, hailstones are known to cause billions of dollars in damage to businesses, agriculture, and homes in the United States alone. Yet meteorologists know relatively little about how they actually form. For decades, meteorologists believed that hailstones get tossed up and down inside a thunderstorm’s updraft like ping-pong balls. They believed that the stones went through a recycling process, layering on ice until they grew too heavy and fell to the ground.
But a new laboratory technique that reads subtle chemical hailstone “fingerprints” has both complicated and enriched that idea. Scientists can now reconstruct the altitude, temperature, and motion history of individual hailstones through a storm. They are able to do this by measuring stable isotopes of oxygen and hydrogen in the ice. After sampling 27 hailstones from nine storms in China, the researchers found that most stones did not actually cycle repeatedly through the cloud. Rather, many descended steadily, some surged upward only once, and a few traveled almost sideways before falling. These new findings may change the way we think about hail forecasting and risks. In this article, we will learn more about the most up-to-date science behind a hailstone’s formation and how this affects everyone from farmers to city managers and insurers.
The Study on Hailstone Fingerprints
In April 2025, researchers from Peking University and the Chinese Academy of Sciences published a peer-reviewed analysis in the journal Advances in Atmospheric Sciences. The research team used stable isotope ratios (δ¹⁸O and δ²H) to reconstruct the growth paths of 27 hailstones taken from nine Chinese storms. Isotope values in ice vary with temperature and altitude. By sampling each layer of a stone, the team was able to figure out where, and under what conditions, that layer formed. Quite surprisingly, they found that only one hailstone showed a classic multi-cycle “recycling” pattern.
Additionally, 10 stones appeared to have formed primarily during a steady descent, and 13 showed evidence of a single upward push. Furthermore, three hailstones indicated largely horizontal motion. They also discovered that the tiny “seeds” that become hailstones, known as hail embryos, can start forming over a surprisingly wide temperature range. They found that the strong updrafts remained largely responsible for producing the big, damaging hailstones. However, the dominant trajectories were far simpler than the long-assumed “elevator-ride” model. This project is notable for using a combination of microphysical examination and citizen-sourced samples to start mapping the paths of hailstones from birth to ground.
The Science Behind Hailstones’ Formation
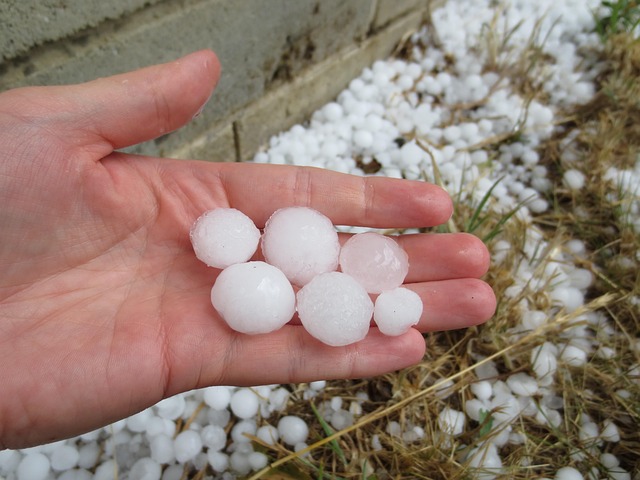
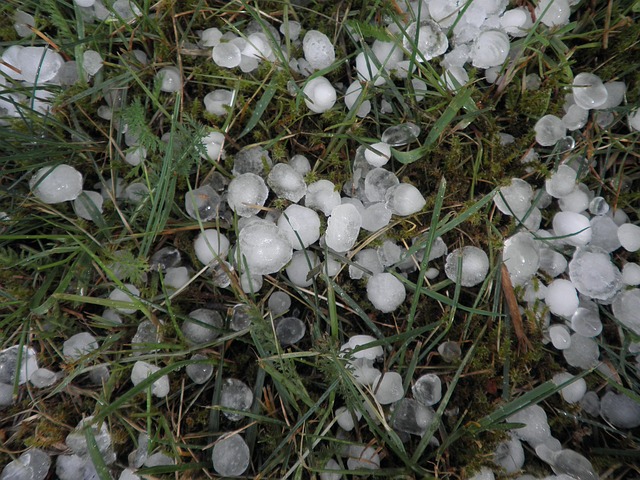
Hail begins with an embryo, a small ice particle or frozen raindrop lifted into the storm’s cold upper levels. The growth of the hailstone happens through riming, which are collisions with supercooled liquid droplets that freeze on contact. In “dry growth,” incoming droplets freeze immediately, trapping air bubbles and producing cloudy layers. In “wet growth,” the surface briefly turns liquid as accretion outpaces freezing, air can escape, and the resulting ice is clearer. Alternating wet and dry phases produce the familiar layered look we observe in hailstones.
The key environmental factors are an adequate updraft to keep the stone aloft, abundant supercooled water in the growth zone, and a nucleus to build upon. Traditionally, forecasters emphasize a “hail growth zone” somewhere between −10 °C and −30 °C. In this zone, supercooled water is plentiful, and radar signatures of strong updrafts suggest a higher chance of severe hail. The new isotope study doesn’t discard these fundamentals. Instead, it reveals that the pathways through that zone are much more varied than just an up-and-down conveyor belt. This may nudge models toward a wider spectrum of trajectories that still depend on the same physical factors.
Hailstone Fingerprints
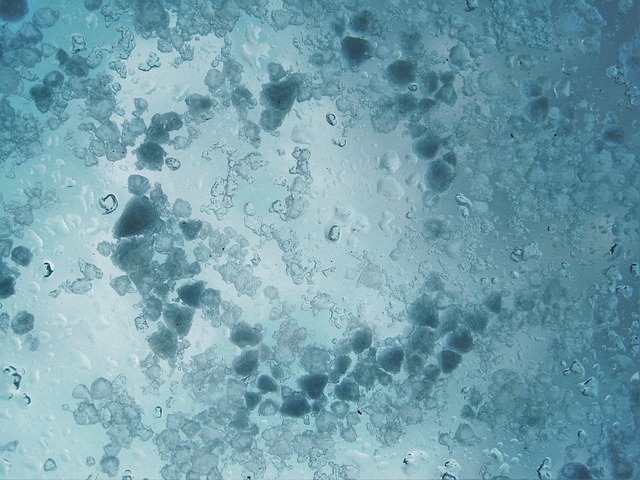
Stable isotopes act as natural tracers. This is because phase changes in water and temperature gradients fractionate heavy and light isotopes in predictable ways. When supercooled droplets freeze onto a hailstone, the isotopic signature of that layer records the ambient conditions at that moment. By micromilling concentric layers and analyzing δ¹⁸O and δ²H, researchers can construct a vertical thermodynamic “map” of the stone’s history. If a stone repeatedly cycles between warmer and colder layers, its isotopic profile oscillates accordingly. This is the classic recycling model. If a hailstone goes up once and then comes down, its isotope record shows just one change.
When most of its growth happens while falling, the record shows a long, steady descent through the growth zone. The Chinese team’s big step was studying enough hailstones from many storms to see overall patterns, not just odd cases. They found very few stones that kept looping up and down. Most either had one strong lift or mainly grew while falling. That means powerful, deep updrafts can still make large hail without repeated trips. Next, scientists will likely combine isotope data with tiny particles trapped in the ice, special radar signals, and storm models to build clearer “life stories” for dangerous hail.
How Will this Change Forecasting?
Forecasting hail mostly comes down to three things: how strong the rising air is, how deep the part of the storm is where hail can grow, and how much supercooled liquid water is available to freeze onto the stone. Radar can provide clues about the updraft and what kinds of particles are inside the storm. Additionally, weather balloons and models tell us how deep the growth zone is. Computer models then combine all this to estimate the chance and size of hail. The new isotope evidence suggests we don’t have to assume hailstones keep looping up and down to get big.
Sometimes one strong lift into the growth zone, followed by a long fall through layers rich in supercooled water, is enough. That matters for fast-moving supercells, where brief but intense updrafts occur. NOAA training already teaches that hail layers form differently in “dry” versus “wet” growth. The isotope method helps check those assumptions in real storms, so we miss fewer events when storms pulse. The biggest payoff is that there should be better estimates on hailstone size and a closer match between what radar suggests and what people actually experience.
How Climate Change Affects Hail
Globally, climate change reshapes hail risk in complex ways that are region-specific. Warmer low levels increase atmospheric moisture and instability, which can favor stronger updrafts and abundant supercooled water. However, higher freezing levels can increase melting before the hailstones reach the ground. This can potentially reduce observed hail in some areas while increasing severe hail elsewhere. Recent studies focusing on China combined historical records and modern observations. They revealed that hailstorm days vary with warming, circulation patterns, and natural variability, with scenarios projecting future increases in some regions.
Studies from Europe show there isn’t one simple trend for hail as the climate warms. Some places may see more severe hail, others less. This is because storm paths are shifting and the air’s temperature and moisture are changing in different ways regionally. Because of that, local planners should rely on detailed models that are checked against real observations, not broad averages. Building a library of hailstones analyzed by isotopes can help scientists figure out which factors matter most in each area. For example, they can test whether bigger hail comes mainly from a deeper “hail growth zone” or from wind patterns that create stronger wind shear. Knowing which of these is driving the change in a specific corridor may help forecasters and cities prepare more efficiently.
Impact on Infrastructure and Agriculture
Hail already inflicts billions in annual losses to crops and property, and it’s a growing concern for the clean-energy transition. Massive solar farms in regions prone to hailstorms have seen catastrophic panel damage from large hailstones. In fact, insurers now often require active stow strategies that tilt panels at a steep angle when hail warnings are issued. As forecasting incorporates more realistic hail growth pathways, operators can better balance false alarms against missed events. This would potentially decrease the unnecessary stow costs and wear associated with false alarms. For farmers and agronomists, subtle shifts in hailstorm timing and track speed affect everything from their planting decisions to crop insurance pricing.
City planners can use better risk maps to decide where stronger roofs and covered parking are worth the cost. These maps help indicate how often big hail is likely to hit an area. When standards match the real risk, new neighborhoods suffer fewer losses and insurance stays more predictable. The isotope method can explain why some storms make large, fast-falling hail even when stones don’t loop up and down repeatedly. If scientists combine the isotope results with local radar, they can spot storm patterns that typically produce the worst hail. That insight improves short-notice forecasts, so solar farms can stow panels, airports can move aircraft, and residents can protect cars.
Citizen Science and the HIWeather Connection
A rather cool aspect of the new research is how ordinary people have contributed extraordinary data. Researchers coordinated with a World Meteorological Organization–affiliated effort, inviting citizens to collect hailstones during storms and store them for lab work. That move expanded the sample set beyond what any single field campaign could gather. Furthermore, it diversified storm types and regions. Weather groups sometimes ask volunteers to help during severe storms. Their reports fill in gaps where no instruments are nearby. For hail research, the most useful help is collecting good samples and basic details about them.
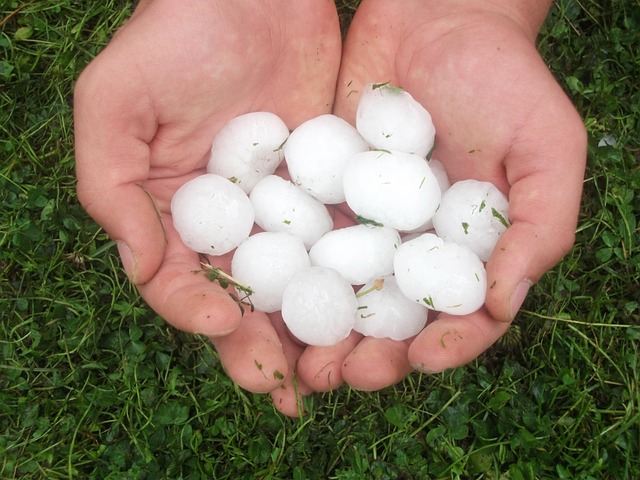
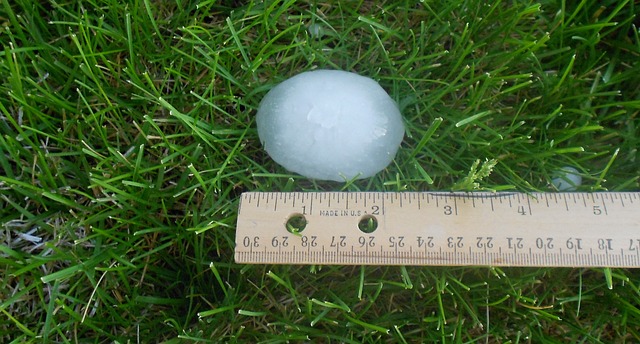
Those details should include the time, exact location, and, if possible, a screenshot of local radar. A reference photo with the stone next to a ruler also helps. Scientists then compare this info with special radar data and weather soundings to check how the storm behaved. Over time, lots of well-documented samples can reveal local patterns. For example, some areas might mostly produce stones that grow while falling when wind changes significantly with height. Other areas might indicate stones that grew after one big lift in certain types of storm. If your area gets hail often, your national weather office or a trained spotter program may welcome your reports.
Why Are There Layers in a Hailstone?
So, if most stones don’t recycle repeatedly, why do so many hailstones have layered cross-sections? Well, the answer lies in wet/dry transitions as a stone traverses micro-environments within the growth zone. A hailstone doesn’t need to ride up and down many times to get layers. One strong lift and a long fall can carry it through patches with different temperatures and amounts of liquid water. That alone can create alternating clear and cloudy bands.
Swirls and sideways winds can also push the stone into new parts of the storm, changing how it grows without any full vertical loops. Training guides note that layer clarity mainly depends on how fast the surface freezes and how much air gets trapped, not on the number of trips. Isotope tests make this clear by linking each layer’s chemistry to the temperatures the stone actually experienced. So, the idea is to keep teaching that layers form, but drop the old “elevator ride” idea as the only way hailstones can grow.
What Happens Next
The next big step is combining many data sources. Scientists can line up isotope “paths” from hailstones with special radar images and fast-updating weather models to test and improve hail predictions. Computer models that simulate storms can also use practical rules about when a hailstone is likely to grow from one strong lift versus many loops. Those rules depend on things like wind changes with height, how much storm energy is available (CAPE), and how many supercooled droplets are present. Over time, building a library of hailstone “life stories” could reveal local patterns.
These may help insurers to design automatic payouts based on measured conditions. Researchers can also study tiny particles trapped in the ice, such as dust, soot, or pollen. This way, they may learn what starts hail formation and how air pollution might affect hail size. Adding these fine details to climate tools will sharpen maps showing where severe hail may increase or decrease. For example, European studies already track how about 3°C of warming can change how long hailstorms last. Ultimately, small clues inside the ice can lead to much better forecasts and smarter planning in the real world.
The Bottom Line

We used to picture hailstones riding up and down inside storms again and again. However, new evidence reveals that many of them grow in a much simpler way. One strong lift into the cold “growth zone,” a bit of sideways drift, then a long fall through layers filled with supercooled water. This doesn’t replace the basic science; it just explains how those pieces usually work together in real storms. For forecasters, this means tuning their models and reading radar with these simpler paths in mind. Additionally, for communities and businesses, it means smarter protection. Lastly, for scientists, it opens the door to combine tiny chemical clues inside hailstones with radar and computer models. As the climate changes, where and how hail forms, this is exactly the upgrade severe-weather prediction needs right now.
Disclaimer: This article was created with AI assistance and edited by a human for accuracy and clarity.
Read More: Dragon Bravo Fire Near Grand Canyon Explodes into Megafire and Begins Creating Its Own Weather