
The Intergovernmental Panel on Climate Change (IPCC) – the United Nations body that coordinates the world’s largest scientific assessment of climate science – is currently in its seventh assessment cycle, working toward new reports that will define our understanding of global conditions well into the century. The IPCC does not make predictions. It outlines what science tells us is likely under different choices we make about emissions. Right now, those choices are pointing toward a warmer, more crowded, and more technologically complex world by 2050.
The IPCC’s most recent completed work, the Sixth Assessment Report (AR6, 2023), combined with separate data from the United Nations Population Division’s 2024 World Population Prospects and energy outlooks from major research institutions, gives us a detailed picture of what global conditions projected for 2050 look like across climate, population, and technology. This slideshow walks through 22 key forecasts, city by city and topic by topic, grounded in the best available science as of 2026.
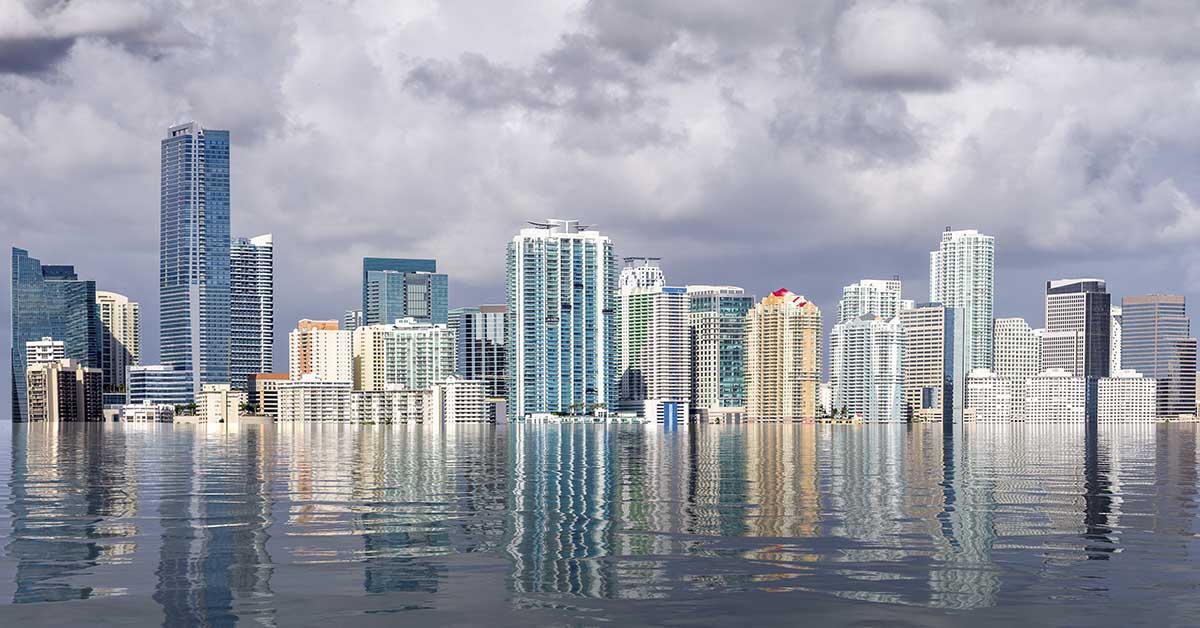
The IPCC Framework – What These Projections Actually Mean
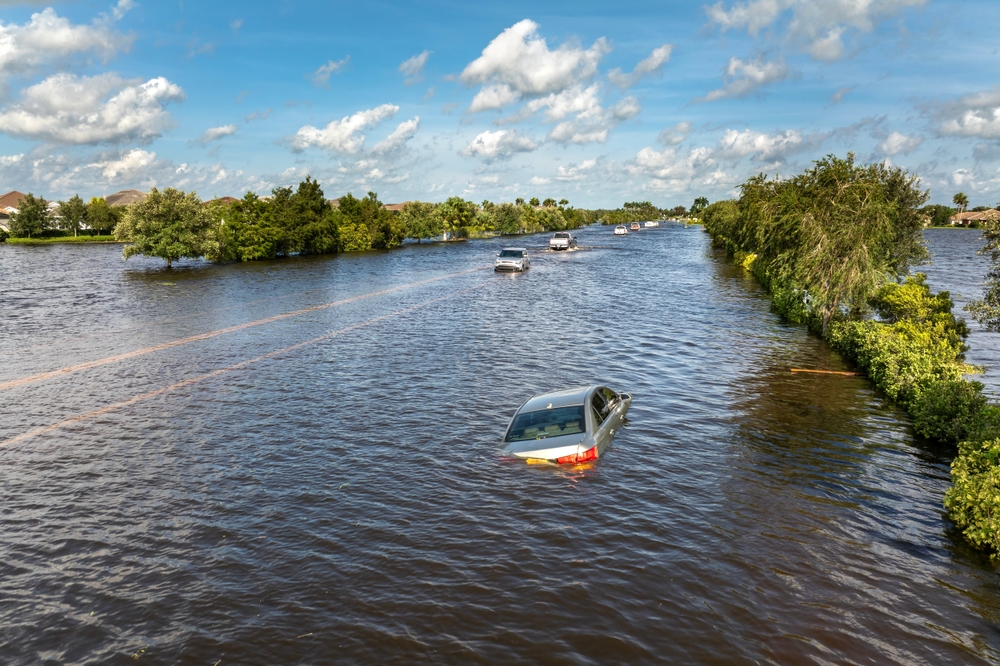
Image credit: Shutterstock.
The IPCC is currently in its seventh assessment cycle, which formally began in July 2023. Before diving into specific forecasts, it helps to understand what the IPCC actually does. It does not run its own experiments. Instead, it synthesizes thousands of peer-reviewed studies from scientists around the world and translates those findings into structured reports that governments use for policy decisions.
UNEP’s 2025 Emissions Gap Report shows that even if countries fully implement their current climate commitments, global temperatures could still rise by 2.3 to 2.5°C this century. Based on the evidence in the most recent IPCC reports, it is now almost inevitable that 1.5°C of global warming will be exceeded in the near term – unambiguously due to insufficient climate action and continued increases in greenhouse gas emissions.
The Temperature Trajectory – Where We Are Heading

Image credit: Shutterstock.
The World Meteorological Organization has confirmed that 2024 was the warmest year on record, reaching 1.55 degrees Celsius above preindustrial levels, with the long-run trend standing at between 1.34 and 1.42 degrees Celsius. That single data point is critical. We are already at or above the 1.5°C threshold that the Paris Agreement set as its most ambitious target.
The burning of fossil fuels is progressing at about 0.27°C per decade, according to the World Meteorological Organization (2024) and Copernicus Climate Change Service data (2025). Keep that rate in mind as you read through the city-level forecasts ahead. Every decade of delay locks in more warming that is essentially irreversible on a human timescale.
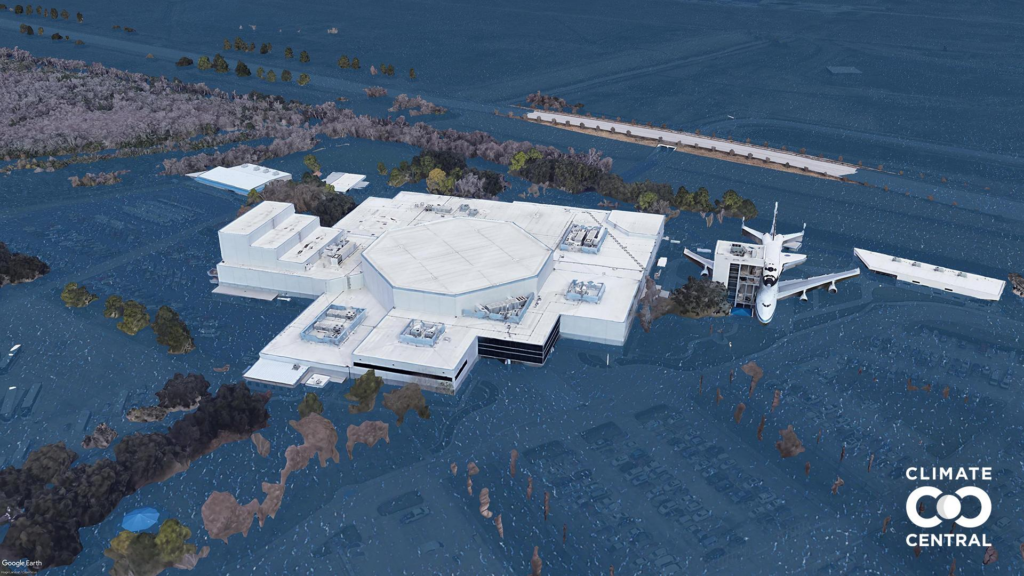
Washington D.C. – Heat and Rising Seas in the US Capital
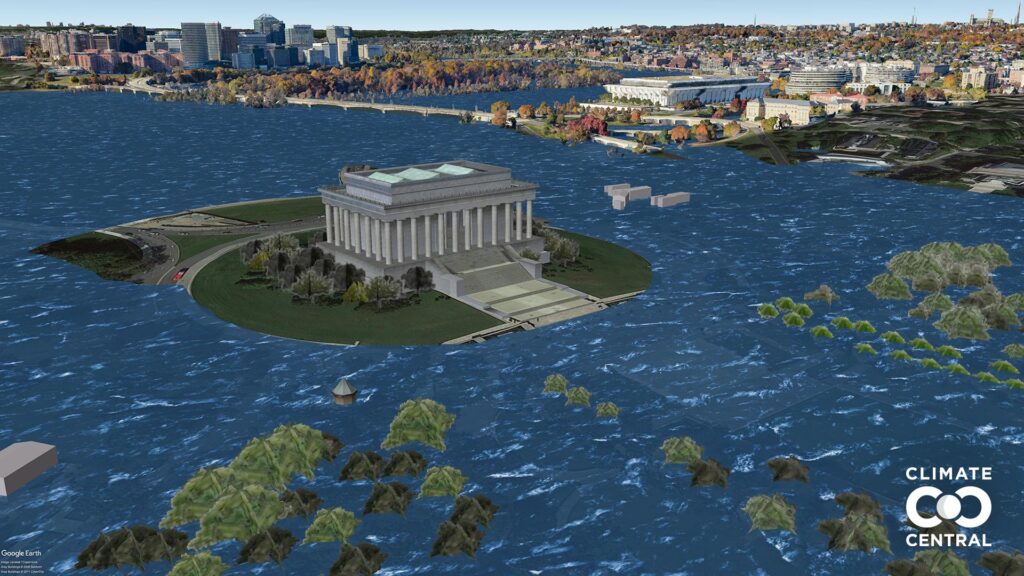
Climate Central’s Picturing Our Future tool provides photorealistic visualizations of what sea level rise would look like at specific locations under different warming scenarios – from 1.5°C to 4°C. For Washington, D.C., the images are among the most striking in the database. Under a 3°C warming pathway, large portions of the low-lying areas around the capital face sustained inundation.
According to Climate Central’s 2025 Shifting Cities analysis, New York is projected to warm by 7.6°F, with summers more like present-day Columbia, South Carolina. Washington, D.C., faces a similar trajectory. According to an earlier analysis by Crowther Lab at ETH Zurich, Washington D.C.’s climate will be more like today’s Nashville – but with even greater variation in temperatures and precipitation. That means hotter summers, more unpredictable winters, and stronger storms.
New York City – Coastal Flooding and Summer Extremes
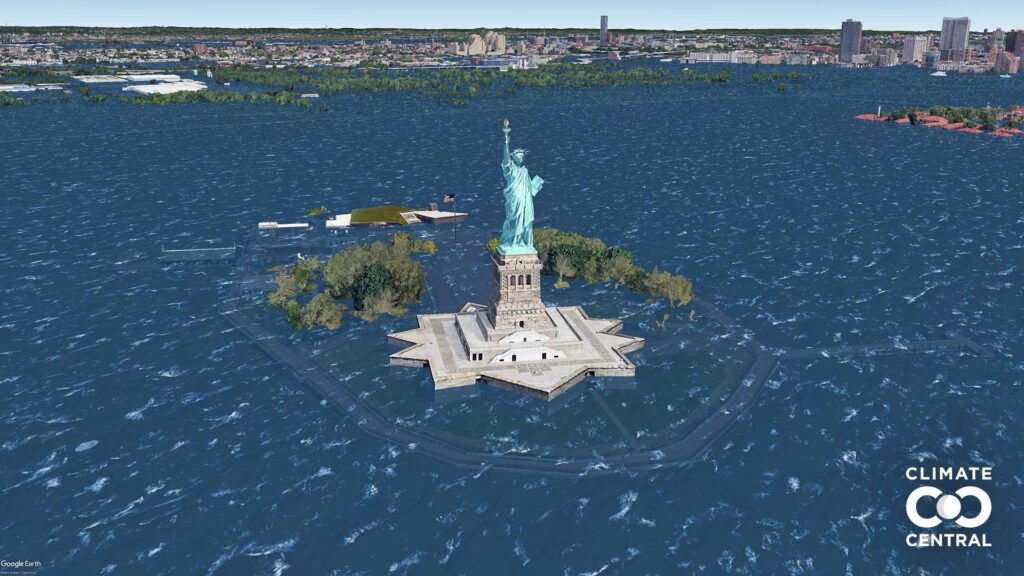
According to the 2022 Sea Level Rise Technical Report from the National Ocean Service, the United States will see a foot of sea level rise by 2050, which will regularly damage infrastructure like roads, sewage treatment plants, and power plants. For New York City, that foot of rise – baked in regardless of future emissions choices – means the flooding events that once happened once a decade could start happening every few years.
Under moderate sea-level rise conditions with unchecked pollution, substantial sea-level rise is projected for Hudson and Bergen counties in New Jersey, with Manhattan largely spared only under the most favorable assumptions. Climate Central’s visualizations make this concrete: familiar streets, recognizable neighborhoods, rendered with rising water lines that challenge every assumption of permanence.
San Francisco – The West Coast Under Pressure
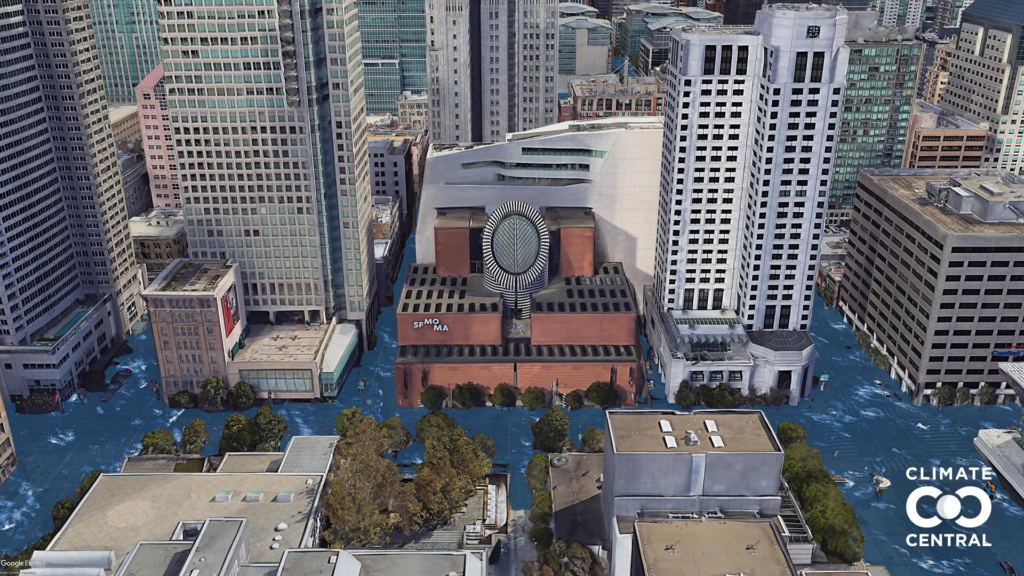
San Francisco sits on one of the most iconic coastlines in North America. Los Angeles is projected to warm by 5.8°F by 2100, with summers more like present-day Túxpam de Rodríguez Cano, Mexico, according to Climate Central’s 2025 analysis. San Francisco faces a comparable, though slightly more moderate, shift – driven by its coastal position and marine influence. The overall direction is the same: warmer, drier summers and a coastline under increasing stress from the ocean.
Research published in Nature Communications found that by 2050, sea level rise will push average annual coastal flood lines higher than land now home to 300 million people worldwide. California’s coastal cities, including San Francisco, are in that count. The Climate Central tool shows the city’s waterfront districts at risk under a 3°C and 4°C scenario, with the gap between action and inaction visually stark.
Houston and the Gulf Coast – Flooding Becomes the Norm
Chicago is projected to warm by 9.1°F by 2100, with summers more like present-day Montgomery, Alabama, while Houston is projected to warm by 6.4°F with summers more like present-day Lahore, Pakistan, according to Climate Central’s 2025 Shifting Cities analysis. Houston’s risk is compounded by its geography – a low-lying city on the Gulf Coast with an extensive system of bayous and flood plains.
By 2050, relative sea level rise projections range from 0.55 to 0.65 meters along the Gulf Coast, according to NOAA’s sea level rise scenarios – higher than along either the East or West Coast. That is nearly two feet of sea rise locked in by mid-century. Combined with stronger hurricane activity driven by warmer ocean waters, the Gulf Coast faces a genuinely transformed risk landscape.
Tampa, Florida – Rising Seas and Growing Flood Risk
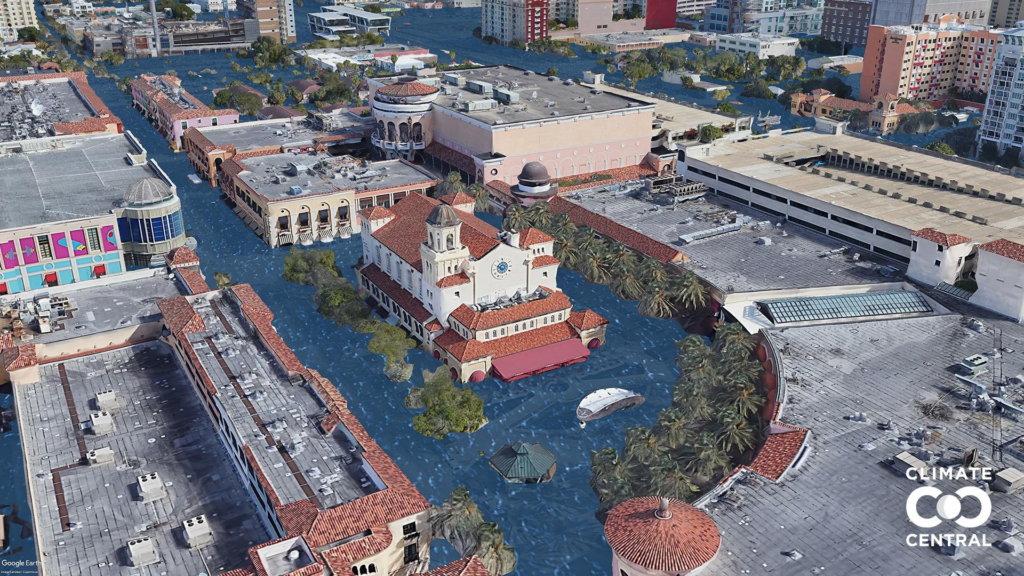
Tampa sits along Florida’s Gulf Coast, a region especially vulnerable to rising sea levels and storm surge. While the city has historically avoided direct hits from major hurricanes, that relative luck may not hold as climate patterns shift. Warmer ocean temperatures are fueling stronger storms, while even small increases in sea level are making storm surge more destructive when it does occur.
By 2050, projections suggest that parts of the Tampa Bay area could experience more frequent coastal flooding, particularly during high tides and heavy rainfall. Low-lying neighborhoods and critical infrastructure, including roads and drainage systems, are at growing risk. What was once considered a “100-year flood” event could begin happening far more often, changing how residents and planners think about safety and development.
At the same time, Tampa’s rapid population growth adds another layer of pressure. More people, more buildings, and more demand for coastal living increase exposure to these risks. The city’s future will likely depend on how quickly it can adapt, investing in resilient infrastructure and rethinking development in vulnerable zones before rising waters force those changes.
Vancouver, Canada – Rising Seas and Changing Coastal Risks
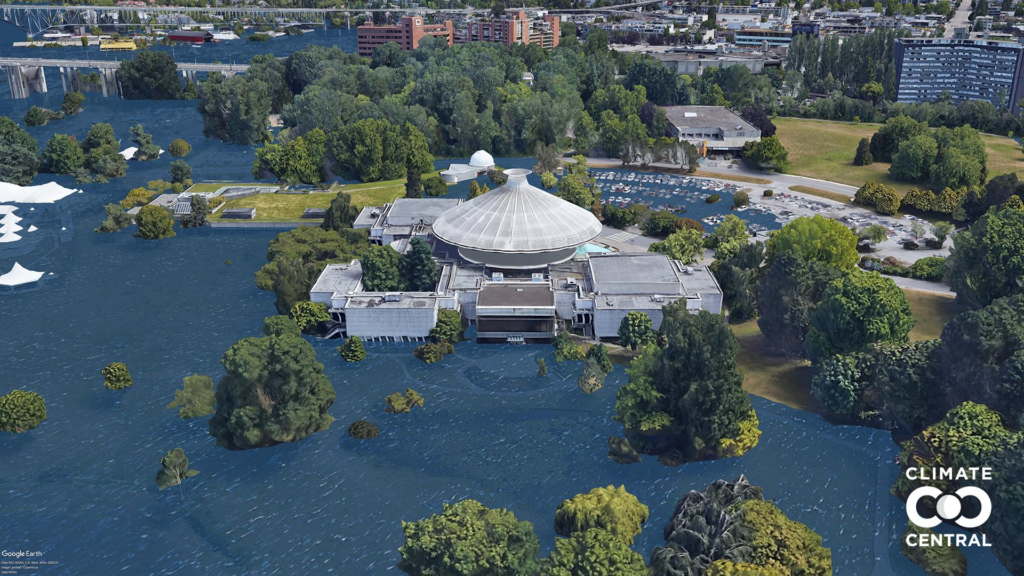
Vancouver sits on Canada’s Pacific coast, where rising sea levels and shifting weather patterns are already beginning to reshape long-term planning. According to projections from Natural Resources Canada and the IPCC, sea levels along British Columbia’s coast could rise by approximately 0.5 meters by 2100 under moderate emissions scenarios, with measurable impacts already expected by 2050. Even smaller increases matter in a city like Vancouver, where key areas such as Richmond and parts of the Fraser River delta lie at or near sea level.
Climate models also point to more intense rainfall events across the region. Warmer air holds more moisture, which increases the likelihood of heavy downpours and urban flooding. Combined with rising seas, this creates a compounding effect, where stormwater drainage becomes less efficient during high tides. According to Environment and Climate Change Canada, extreme precipitation events in the region are expected to become more frequent and more intense as the climate warms.
London – Europe’s Climate Shifts Northward
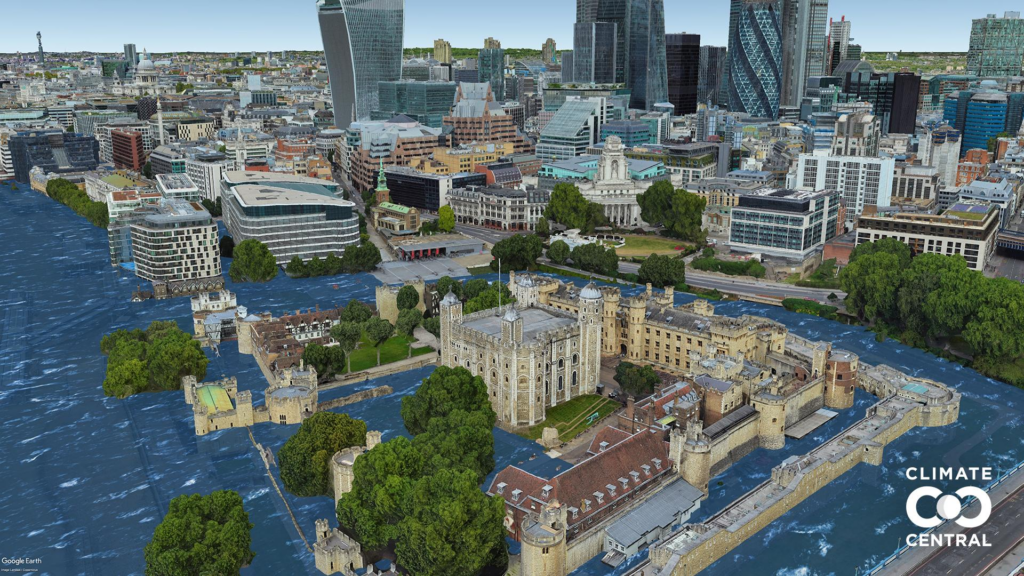
Climate forecasts for 2050 suggest damp and cold London will become hot and dry like Barcelona, according to analysis by the Crowther Lab at ETH Zurich published in PLOS ONE. That is a dramatic shift – London gaining the summer climate of a Mediterranean city more than 1,000 miles to the south.
In Europe, the frequency and intensity of hot extremes are increasing and will continue to do so. In contrast, glaciers and snow cover will continue to disappear, according to findings from the IPCC’s Sixth Assessment Report. For a city whose infrastructure was built for cool, wet weather – where air conditioning has historically been a rarity – the logistical and public health challenges of a Barcelona-style summer are considerable. Climate Central’s sea level tool also shows parts of the Thames estuary and London’s low-lying east under pressure under high-warming scenarios.
Copenhagen – Northern Europe Faces Rising Seas
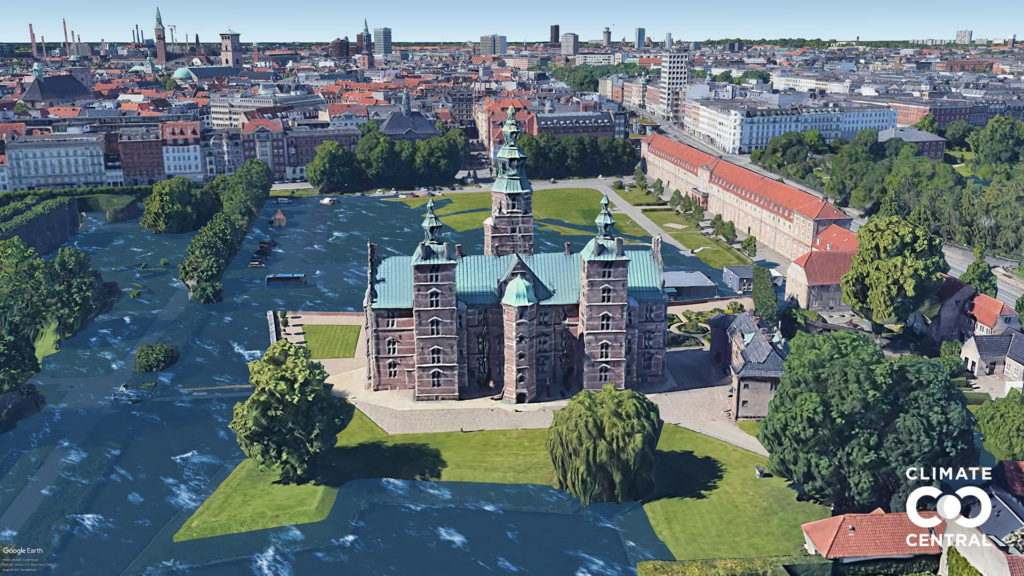
Copenhagen sits at the edge of the North Sea, making it acutely sensitive to sea level projections. Higher levels of warming will require globally unprecedented defenses against flooding or force abandonment in scores of major coastal cities worldwide. If warming is limited to 1.5°C through strong compliance with the Paris Agreement, these consequences may be limited to a handful of locations.
About 50 major cities around the world are at risk of losing most of their developed areas to unremitting sea level rise over the next century and beyond. New research from Climate Central scientists, in collaboration with Princeton University and the Potsdam Institute for Climate Impact Research in Germany, shows that nations will need to mount globally unprecedented defenses to protect populations in these areas under the 3°C emissions pathway. Copenhagen is among the cities in Climate Central’s Picturing Our Future database, with visualizations available at 1.5°C, 2°C, 3°C, and 4°C warming levels.
Rio de Janeiro – Tropical Cities Face Novel Climates
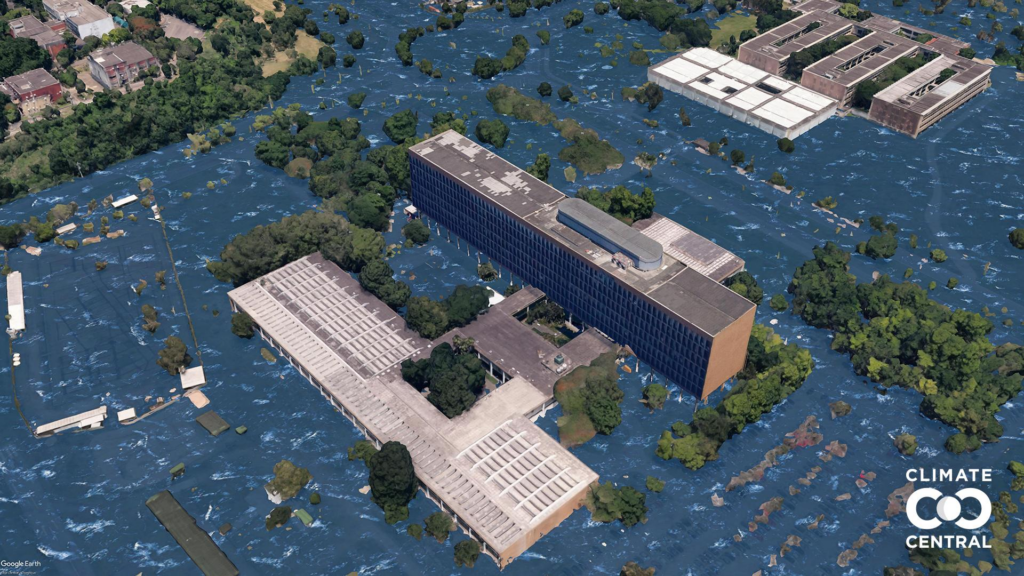
The vast majority of cities that will experience “novel” climates – with no current equivalent anywhere on Earth – are in the tropics, including major metropolises like Kuala Lumpur, Jakarta, Rangoon, and Singapore. Changes in tropical cities will be less about temperature increases and more dominated by more frequent extreme precipitation events and the severity and intensity of droughts.
Rio de Janeiro sits squarely in this category. Its combination of coastal lowlands and steep hillside neighborhoods creates a layered vulnerability: sea level rise threatens the coast while intensified rainfall threatens the favelas built on slopes. Climate Central’s visualizations show Rio’s famous coastline significantly altered under high-warming scenarios. Learn more about how heat waves specifically affect human health as these temperatures climb.
Cape Town – Africa Warming Faster Than the Global Average
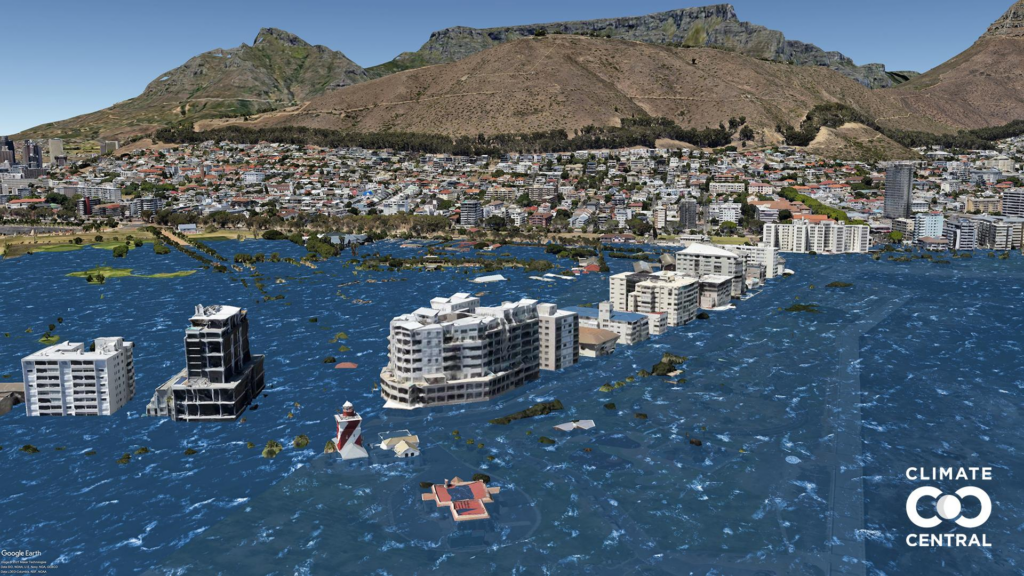
The African continent is already experiencing higher warming and sea level rise than the world average. In the next decade, Africa will see more frequent and intense heatwaves – up to five times more common in 2050 than today – as well as heavier precipitation, more frequent and intense droughts, and more common and severe coastal flooding, according to the IPCC’s Sixth Assessment Report.
Cape Town is a particularly stark case. The city already experienced a near-catastrophic water crisis in 2018. Under higher warming scenarios, the combination of drought risk, coastal flooding, and intense rainfall events creates a triple threat. Climate Central’s Picturing Our Future database includes Cape Town visualizations showing the city’s famous waterfront neighborhoods under different sea level scenarios, with the difference between 1.5°C and 3°C dramatically visible.
The Hague – The Netherlands’ Existential Challenge

Few places on Earth are more directly threatened by sea level rise than the Netherlands. Much of the country already sits below sea level, held back by an extraordinary system of dikes and water management infrastructure. Full differences in sea level rise caused by higher versus lower emissions pathways will take centuries to unfold – but these consequences will be determined by humanity’s actions in the coming few decades.
At 3°C of warming, sea levels may ultimately rise as high as 21 feet (6.4 meters), according to Climate Central’s peer-reviewed research. The Hague is featured in Climate Central’s Picturing Our Future database, with Google Earth imagery showing what different warming scenarios mean for one of Europe’s political capitals. The Netherlands’ existing defenses are factored in separately – the visualizations show raw exposure before human intervention, which is why the images are so sobering.
Melbourne and the Southern Hemisphere
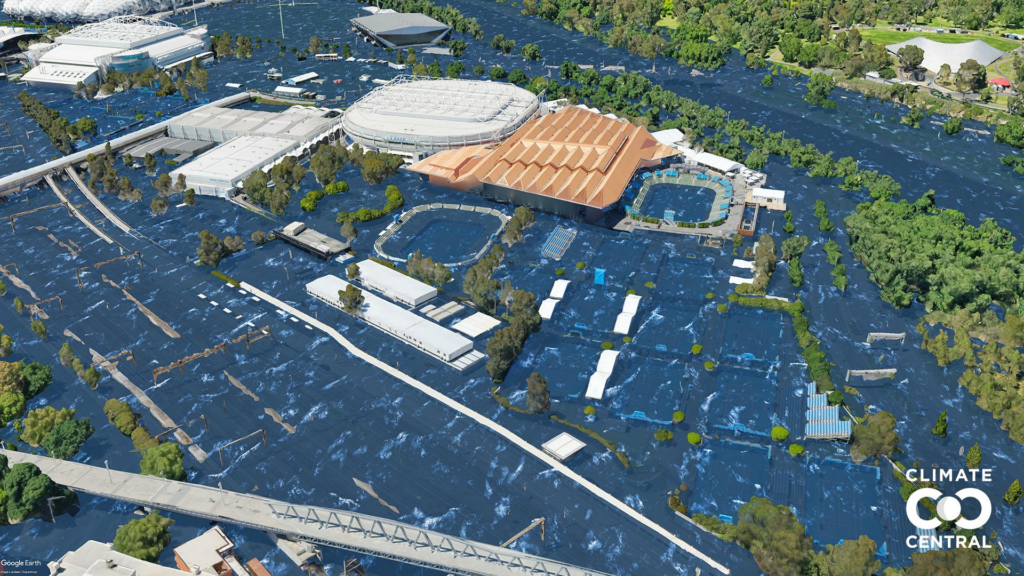
Melbourne faces its own set of IPCC-aligned risks. Australia’s climate trajectory includes longer droughts, more intense bushfire seasons, and coastal flooding for its major cities. Some changes, such as droughts, wildfires, and extreme rainfall, are happening faster than scientists previously assessed, according to NASA’s overview of IPCC findings.
Climate Central’s database includes Melbourne under Google Earth imagery at multiple warming levels. The Australian experience already demonstrates in real time what the IPCC projects: record-breaking heat events, catastrophic fire seasons like the 2019-2020 Black Summer, and coastal flooding becoming more frequent. The gap between 1.5°C and 3°C of warming is not abstract for Melbourne – it is the difference between manageable adaptation and fundamental disruption of the city’s livability.
What the IPCC Predicts for 2050 – The Headline Numbers
So what does the IPCC predict for 2050? The answer depends entirely on the emissions pathway humanity follows. The IPCC’s findings indicate that all scenarios involve continued warming for decades, rising sea levels for centuries to millennia, and Arctic ice-free summers within 30 years.
Projections indicate that by 2050, droughts may affect over three-quarters of the world’s population, and an estimated 4.8 to 5.7 billion people will live in areas that are water-scarce for at least one month each year, up from 3.6 billion today. On food: the IPCC’s Sixth Assessment Report estimates up to a 29% increase in the cost of cereals by 2050, depending on the amount of warming. These price increases will impact consumers globally, with low-income consumers at particular risk of malnutrition.
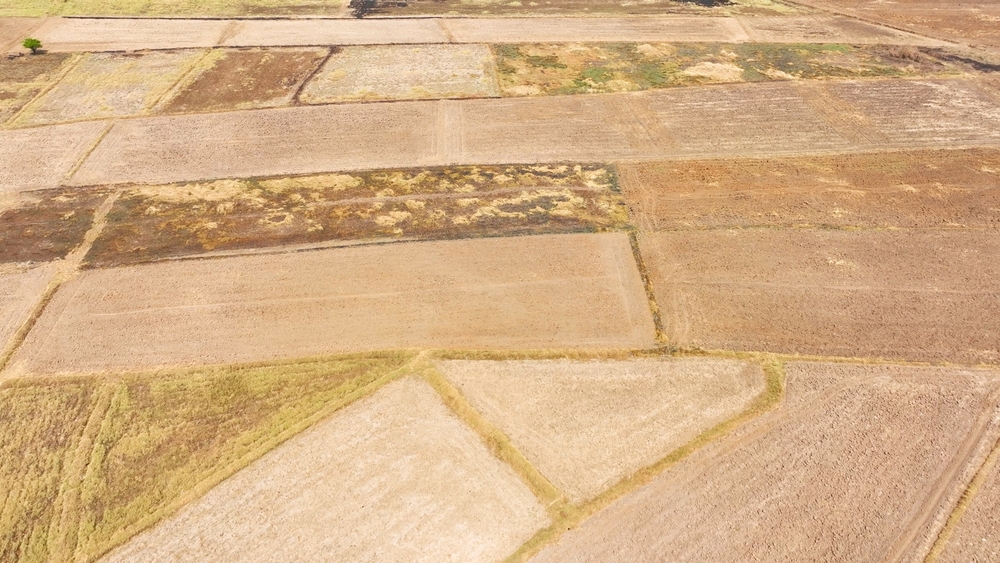
How Climate Change Will Affect the World by 2050 – Food and Water

Research published in Scientific Reports in 2024, using a large-scale computational global climate and trade model, projects substantial declines in global food production of some 6%, 10%, and 14% by 2050 under different emissions scenarios, with the number of additional people with severe food insecurity by 2050 increasing by 556 million, 935 million, and 1.36 billion compared to the 2020 baseline.
Those are not distant abstractions. They translate to grocery prices, access to affordable nutrition, and the political stability of countries where food insecurity drives conflict. More than half of the global population already contends with severe water scarcity for at least one month per year, and by 2050, droughts might affect up to two-thirds of the world’s population. The IPCC is clear: limiting warming to 1.5°C versus 2°C or 3°C makes an enormous difference to these numbers.
World Population by 2050 – A Planet of Nearly 10 Billion
According to the United Nations’ World Population Prospects 2024 report, the global population in 2050 is expected to reach around 9.66 billion people – a growth of nearly 1.5 billion from the current population. That number shapes every other projection in this article. More people mean more demand for food, water, energy, and housing – all of which interact directly with climate stress.
From 2024 to 2050, eight countries are expected to account for about half of the world’s projected population increase: India, Nigeria, the Democratic Republic of the Congo, Pakistan, Ethiopia, Tanzania, Egypt, and Indonesia. Notably, according to the UN, all of the predicted growth in world population between 2020 and 2050 will come from less developed countries, and more than half will come from sub-Saharan Africa. These are also the regions most vulnerable to climate impacts – a convergence that makes global inequality a defining challenge of the coming decades.
An Aging, Urbanizing World – The Demographic Shift

Population growth does not tell the whole story of the 2050 world. Today, more than half of the global population lives in urban areas, up from around one-third in 1950, and this is projected to increase to around two-thirds by 2050, according to the UN’s World Population Prospects 2024.
Global life expectancy at birth, which rose from 64.0 years in 1990 to 73.3 years in 2024, should continue to rise to as high as 77.0 by 2050. Between now and the second half of the 2070s, the number of people aged 65 or over worldwide is expected to reach 2.2 billion and pull ahead of the number of people under 18. An older, more urban world will put new demands on healthcare systems, pension structures, and the design of cities – especially as climate events disproportionately affect the elderly and the vulnerable.
Climate Migration – People on the Move by 2050
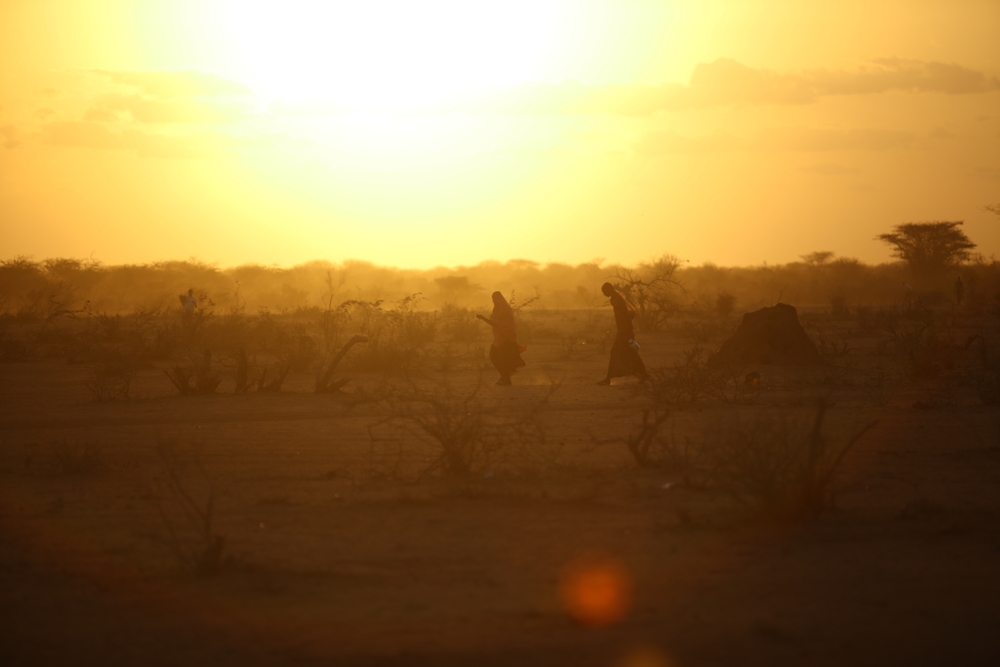
In 2018, the World Bank estimated that three regions – Latin America, sub-Saharan Africa, and Southeast Asia – would generate 143 million more climate migrants by 2050. That figure is likely conservative given updated warming projections.
According to a UNHCR report, “No Escape: On the Frontlines of Climate Change, Conflict and Forced Displacement,” by 2040, the number of countries facing extreme climate-related hazards is expected to rise from 3 to 65, the vast majority of which host displaced people. Similarly, most refugee settlements and camps are projected to experience twice as many days of dangerous heat by 2050. Climate migration is not a future possibility – it is already happening. By 2050, the scale is expected to be one of the defining humanitarian challenges of the century.
Havana and Small Island Nations – Existential Threats

Climate Central has created fly-over videos and realistic renderings that contrast the projected future sea levels in coastal cities around the world, including photorealistic images of Plaza de la Catedral, Havana, Cuba. For Havana, the images are striking: the historic waterfront neighborhood surrounded by Caribbean water under high-warming scenarios.
The most foreseeable case of migration as a response to climate impacts will likely be the Pacific Islands. The sea level rise at a rate of 12 millimeters per year has already submerged eight islands in the western Pacific. Two more are on the brink of disappearing, prompting waves of migration to larger countries. For these communities, 2050 is not a distant forecast – it is an urgent timeline within living memory of today’s children.
Technology by 2050 – The Energy Transition

The IPCC 2050 climate population and technology forecast cannot ignore the energy picture. Under all scenarios analyzed by the Resources for the Future Global Energy Outlook 2025, renewable energy sources led by wind and solar are more than 50% of electricity generated in 2050. That is a fundamental shift from today’s energy mix, and it is being driven by economics as much as policy: solar and wind are now cheaper than fossil fuels in most parts of the world.
BloombergNEF’s New Energy Outlook 2025 projects a 75% rise in electricity demand from AI and data centers by 2050 and 362 GW of additional capacity needed by 2035. The intersection of AI and energy is one of the most consequential technology stories of the coming decades. More computing power means more electricity demand – and how that electricity is generated will shape whether the technology future accelerates or undermines the climate transition.
AI, Renewables, and the Path Forward
By 2050, renewables are projected to account for over 70% of global energy production, with solar and wind energy driving this transformation, according to a 2025 study published in ScienceDirect on AI’s role in accelerating renewable energy adoption. The same research highlights how AI tools are being used to optimize energy grids, improve solar and wind forecasting, and accelerate the deployment of clean energy infrastructure.
AI also presents a transformative opportunity for accelerating the transition to a net-zero future. AI’s unique ability to process vast amounts of complex data on energy systems, emissions, and climate impact allows for more informed and data-driven approaches to cutting carbon emissions. This is a two-sided coin: AI creates energy demand while also offering tools to manage and reduce it. The net result depends on policy choices made in the next few years – precisely the window the IPCC says is most critical.
Read More: New Study Predicts Grim Future for the Arctic by 2100 if Climate Change Persists
What This Means for You
We have the opportunity now to change this flooded future. Meeting the most ambitious goals of the Paris Climate Agreement will likely reduce exposure by roughly half, allowing nations to avoid building expensive and unprecedented defenses or abandoning many major coastal cities. That is the core message of every slide in this article. The forecasts are not fixed. They are projections – and projections can change based on the choices we make. The difference between a 1.5°C world and a 3°C world is measured in hundreds of millions of people’s safety, food security, and displacement. The science on this point is unambiguous.
What you can do with this information is real. Pay attention to where candidates and officials stand on emissions targets. Understand that the cities you live in, visit, or have children growing up in are included in these projections. Use tools like Climate Central’s Picturing Our Future to see what your own city’s coastline looks like under different warming scenarios – it is one of the most effective ways to make the abstract concrete.
According to the IPCC’s AR6 Synthesis Report, developing countries alone will need $127 billion per year by 2030 and $295 billion per year by 2050 to adapt to climate change. The scale of what is needed is enormous – but so is the scale of what is at stake. The IPCC 2050 climate population and technology forecast is not a prophecy. It is a warning with a clear exit ramp, and the next few years will determine whether we take it.
A.I. Disclaimer: This article was created with AI assistance and edited by a human for accuracy and clarity.
Read More: The Cities That Could Disappear by 2030 Due to Climate Change and Rising Seas