

California drivers are paying $5.71 for a gallon of gas right now. Indiana drivers, filling up at the same moment, are paying $3.36. The two states are separated by about 2,000 miles – but the gap at the pump is more than two dollars, and the explanation for it goes well beyond geography.
That gap is part of a broader story that came the light on June 24, 2026, when President Donald Trump posted on Truth Social just after midnight, accusing America’s biggest oil companies of failing to pass on falling crude costs to consumers. Gas prices by state have become a flashpoint, reflecting months of supply-chain chaos, a historic crude oil spike, a conflict in the Middle East, and now a presidential order putting the Justice Department on notice. The map of America’s gas prices tells a story that’s equal parts economics, geopolitics, and political pressure.
To understand where prices stand today, you have to go back to February 28, when the conflict with Iran began and the Strait of Hormuz – one of the world’s most critical shipping corridors – was effectively shut down. According to the U.S. Energy Information Administration, in 2024, oil flow through the strait averaged 20 million barrels per day, representing roughly 20% of global oil consumption. When that supply was choked off, the effect on global oil prices was immediate and severe.
What the Iran War Did to the Pump
Since the start of the conflict on February 28 and the subsequent closure of the Strait of Hormuz, gas prices peaked at $4.55 on May 21, 2026, roughly 54% higher than they were on February 26. Average monthly gas prices surged to $4.48 per gallon in May 2026, up from $4.10 in April and $3.64 in March. Before the war started, Americans were paying $2.98 per gallon on average.
The crude oil market told an even more dramatic story. Crude oil prices tumbled toward $70 per barrel by late June after the gradual reopening of the strait – a significant decline when you consider that prices surged above $100 a barrel in March for the first time since Russia’s 2022 invasion of Ukraine. To stabilize markets during the worst of the crisis, the Department of Energy released 172 million barrels of oil from the Strategic Petroleum Reserve, as the Strait of Hormuz – through which around a fifth of global oil production flows – had become a geopolitical bargaining chip.
The conflict officially wound down when Washington and Tehran signed a deal to end the war on June 17, which included lifting the U.S. naval blockade. Oil prices responded quickly. Gas prices followed – but not fast enough for the White House.
Trump’s DOJ Investigation: What He Said and What the Industry Answered
President Donald Trump said Wednesday that he had instructed the Justice Department to immediately probe oil companies for not lowering gas prices at the pump in line with falling costs, accusing them of “gouging” consumers. Trump did not name specific companies in his Truth Social post, but his frustration with the pace of price declines was pointed. He has publicly said he believes gas should be at $2.25 per gallon, a target that remains far from current reality.
The American Petroleum Institute, which represents the major U.S. oil and gas producers, pushed back. API spokesperson Bethany Williams said in a statement to Newsweek that the industry “shares the goal of delivering relief at the pump and restoring stability to global energy markets,” but added that “gasoline prices don’t move in lockstep with crude oil, especially during a major global disruption that is still affecting supply, refining and inventories.”
Energy economists largely agree with that framing. Academic studies have long documented that gasoline prices tend to shoot up when crude spikes, but take longer to fall – a dynamic often called “rockets and feathers.” The supply chain explanation matters here: it takes a couple of months to move oil from the ground through barges, around the world, into refineries, and through pipelines before it eventually reaches the gas pump.
Jason Bordoff, founding director of the Center on Global Energy Policy at Columbia University, said the president has “very few policy tools that can materially affect oil prices in the near term,” adding that “the most important step is to ensure that the Strait of Hormuz returns to the open and secure state it was in before his attack on Iran.”
The DOJ declined to confirm it would formally launch a probe. A DOJ spokesperson told TIME: “The price of fuel is not only a national security issue, it impacts the wallet of every American. We will always commit to ensuring affordability in this nation.”
Gas Prices by State: The Wide Range Across America
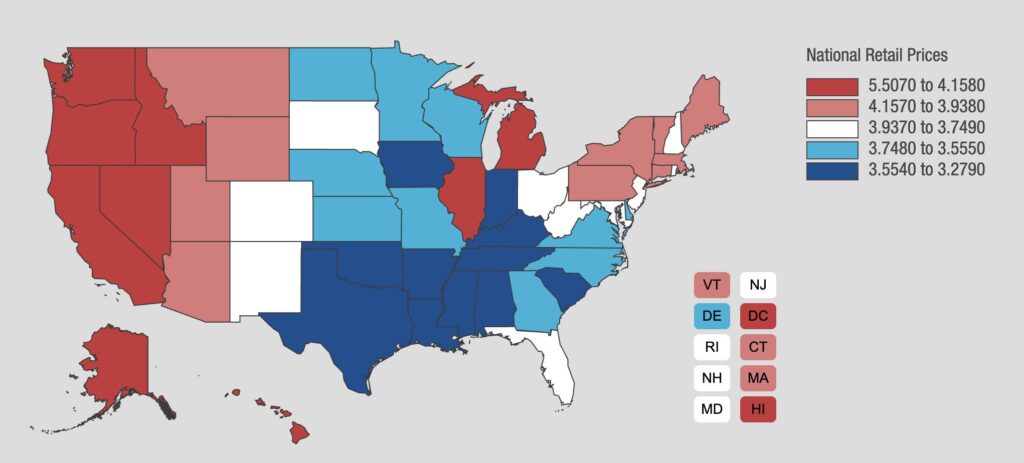
On June 16, 2026, the average U.S. gas price was $4.04 per gallon according to LendingTree’s analysis of AAA data, up 28.8% from $3.14 per gallon a year earlier. By June 24, the national average had edged down to $3.93 per gallon, according to AAA – still roughly 70 cents above this time last year.
The state-by-state picture shows why a single national number can be misleading. The highest average gas price was in California at $5.71 per gallon, followed by Hawaii at $5.58 and Washington at $5.49. Four states had average gas prices above $5.00 per gallon. At the other end of the spectrum, Indiana had the lowest average at $3.36 per gallon, followed by Texas at $3.50 and Oklahoma at $3.53.
The regional pattern reflects structural factors that predate the current crisis. West Coast states – California, Washington, Oregon, Nevada, plus Hawaii and Alaska – carry the highest pump prices, driven by tight refining capacity, special clean-fuel blends, and higher state taxes. Gulf and South-Central states such as Texas, Mississippi, Louisiana, and Oklahoma stay well below the national average, helped by nearby refineries and low fuel taxes.
Year-over-year, the increases have been steep almost everywhere. Average prices rose in every state, ranging from 6.4% in Indiana to 41.9% in New Hampshire. New Hampshire saw the largest increase, rising 41.9% from $2.91 to $4.13 per gallon, followed by New York and Vermont, both up 39.3%. Indiana’s relatively modest 6.4% increase makes sense: the state was already among the cheapest markets in the country before the crisis, and it sits closer to Midwestern refining hubs that were less directly exposed to the Hormuz supply shock.
You can track the latest gas prices by state in real time using AAA’s state gas price averages dashboard, which updates daily.
The Cost Every Household Has Absorbed
The financial toll of the Iran war’s disruption to fuel markets isn’t abstract. Americans spent nearly $450 extra per household on rising energy costs during the Iran war, according to a Moody’s Analytics analysis shared with CNBC. The average household shelled out $447.19 in additional fuel-related expenses since the conflict began, cumulatively costing American consumers nearly $60 billion as gas prices and airline fares surged.
That nearly $450 impact more than erased the boost of $384 per household from bigger tax returns this year under Trump’s “big, beautiful bill,” according to Moody’s. Higher energy costs force consumers to raid their savings and lean more on debt. “Unless the war ends soon, financially pressed consumers will have no option but to turn more cautious in their spending, threatening the already soft economy,” said Mark Zandi, Moody’s chief economist, in the same Moody’s Analytics analysis.
High gas prices haven’t been felt evenly across the country. States such as Wyoming, Utah, and Alaska have experienced increases of more than $1.30 per gallon, while people in states like Florida, Texas, and Indiana are paying less than $0.80 more per gallon. The ripple effects extend far beyond the gas station – from tanker routes to refinery switching cycles to retail distribution networks, the full length of the energy supply chain shapes how long elevated prices persist.
Why the Price Drop Is Lagging Behind the Crude Drop
The math at the core of Trump’s frustration is real. Crude oil is the single biggest cost input for gasoline, and as a rough rule, every $10 change in the price of a barrel of crude oil translates to roughly 25 cents at the pump over the following weeks. That means crude oil’s sharp fall from over $100 per barrel to under $76 should eventually produce meaningful relief – but the operative word is “eventually.”
According to GasBuddy, the national average gas price was 14% lower on June 24 than at the May peak, after the two countries agreed to an interim peace deal and the reopening of the Strait of Hormuz. By comparison, crude oil prices were down 23% over the same period. The gap between those two numbers – 23% down for crude, 14% down for gas – is what Trump is calling gouging. The oil industry calls it mechanics.
While gas prices have been falling for six weeks straight, they remain much higher than the average of $2.76 per gallon recorded in January, before the conflict began. Analysts at GasBuddy have cautioned that gas prices will likely continue to fall slowly, as uncertainty over the Strait of Hormuz and ongoing negotiations keep some risk premium priced into oil markets.
The May 2026 Consumer Price Index from the Bureau of Labor Statistics shows inflation rose to 4.2% over the prior 12 months, with gasoline prices jumping 7.0% in May alone. That inflation backdrop adds weight to the political urgency – with midterm elections approaching, the White House has made falling energy prices a central part of its messaging.
Read More: Why It Could Take Months for Gas Prices to Fall
What This Means for You
The national average as of June 24 is $3.93 per gallon – down significantly from May’s peak but still nearly a dollar above where prices stood before February. If you’re in California, Hawaii, or Washington, you’re absorbing the sharpest burden: all three states remain above $5.40 per gallon. If you’re in Indiana, Texas, or Oklahoma, prices are closer to the national pre-war baseline, though still elevated year-over-year.
For practical budgeting, the trajectory is downward, but the pace is uncertain. The agreement signed on June 17 secured an extended 60-day cease-fire that allows time for further negotiations – but uncertainty surrounding how those additional talks might progress remains a risk factor for energy markets. Refinery transitions, tanker re-routing, and inventory rebuilding all take time, and none of them move at the speed of a presidential Truth Social post.
The most direct action available to drivers right now is to check real-time prices by ZIP code using tools like GasBuddy or AAA’s state dashboard, choose fill-up timing strategically (prices typically dip mid-week), and reduce highway speeds where practical – fuel efficiency drops sharply above 55 mph, according to both AAA and the Department of Energy. For households in high-cost states where the gap above the national average is structural rather than crisis-driven, those habits will remain relevant long after the geopolitical headline fades.
Disclaimer: This information is not intended to be a substitute for professional financial advice, investment advice, tax advice, or legal advice, and is provided for informational purposes only. Always seek the guidance of a qualified financial advisor, accountant, or other licensed professional regarding your personal financial situation or investment decisions. Do not make financial, investment, or tax decisions based solely on information presented here. Past performance is not indicative of future results, and all investments carry risk, including the potential loss of principal.
AI Disclaimer: This article was created with the assistance of AI tools and reviewed by a human editor.